

Skip ahead: If you already know your way around the Performance panel, jump to "Read the Bottom-up tab".
A page feels slow, and you already have a guess about why. Don't fix the guess. Record a profile, let Chrome tell you which function took the time, fix that one function, and record again to prove it helped. This tutorial does exactly that on a small page, start to finish.
The demo page
A warehouse picking list. There are 5,000 products and 6,000 order lines. Each line only has a SKU, so the page looks up the product name and shelf for every line. Save this as slow.html and open it in Chrome:
<!doctype html>
<html lang="en"><head><meta charset="utf-8"><title>Picking list</title></head>
<body>
<h1>Picking list</h1>
<button id="build">Build picking list</button>
<p id="result"></p>
<script>
const products = Array.from({ length: 5000 }, (_, i) => ({ sku: "SKU-" + i, name: "Item " + i, shelf: "A" + (i % 40) }));
const lines = Array.from({ length: 6000 }, (_, i) => ({ orderId: 5000 + Math.floor(i / 3), sku: "SKU-" + ((i * 7919) % 5000), qty: 1 + (i % 4) }));

function findProduct(sku) {
  return products.find(product => product.sku === sku);
}

function buildPickingList() {
  const rows = [];
  for (const line of lines) {
    const product = findProduct(line.sku);
    rows.push({ orderId: line.orderId, name: product.name, shelf: product.shelf, qty: line.qty });
  }
  return rows;
}

document.getElementById("build").addEventListener("click", () => {
  const start = performance.now();
  const rows = buildPickingList();
  document.getElementById("result").textContent = `${rows.length} rows in ${Math.round(performance.now() - start)} ms`;
});
</script>
</body></html>
Click Build picking list. On my run it said 6000 rows in 105 ms. Write your number down. You need it later to know if the fix worked.
Record a profile
- Open DevTools (F12) and go to the Performance tab.
- Untick Screenshots. You don't need them here, and the recording is smaller without them.
- Click the record button (the circle), click Build picking list once, then click Stop.
- In the overview strip at the top, drag across the small yellow block to zoom into the click.
Keep the recording short. One click, then stop. A 30-second recording of a 100 ms problem is mostly noise.
Read the flame chart
Under Main you see the click as a stack of bars: Event: click, the click handler, buildPickingList, and under it many findProduct bars. Wide bars took a long time. The bars underneath are the functions they called. So you already know the click time is spent inside buildPickingList, but not yet which part of it.
Read the Bottom-up tab
Open the Bottom-up tab under the flame chart. It lists every function by Self time, the time spent in that function's own code, not in the functions it called. This is the column that points at the culprit.
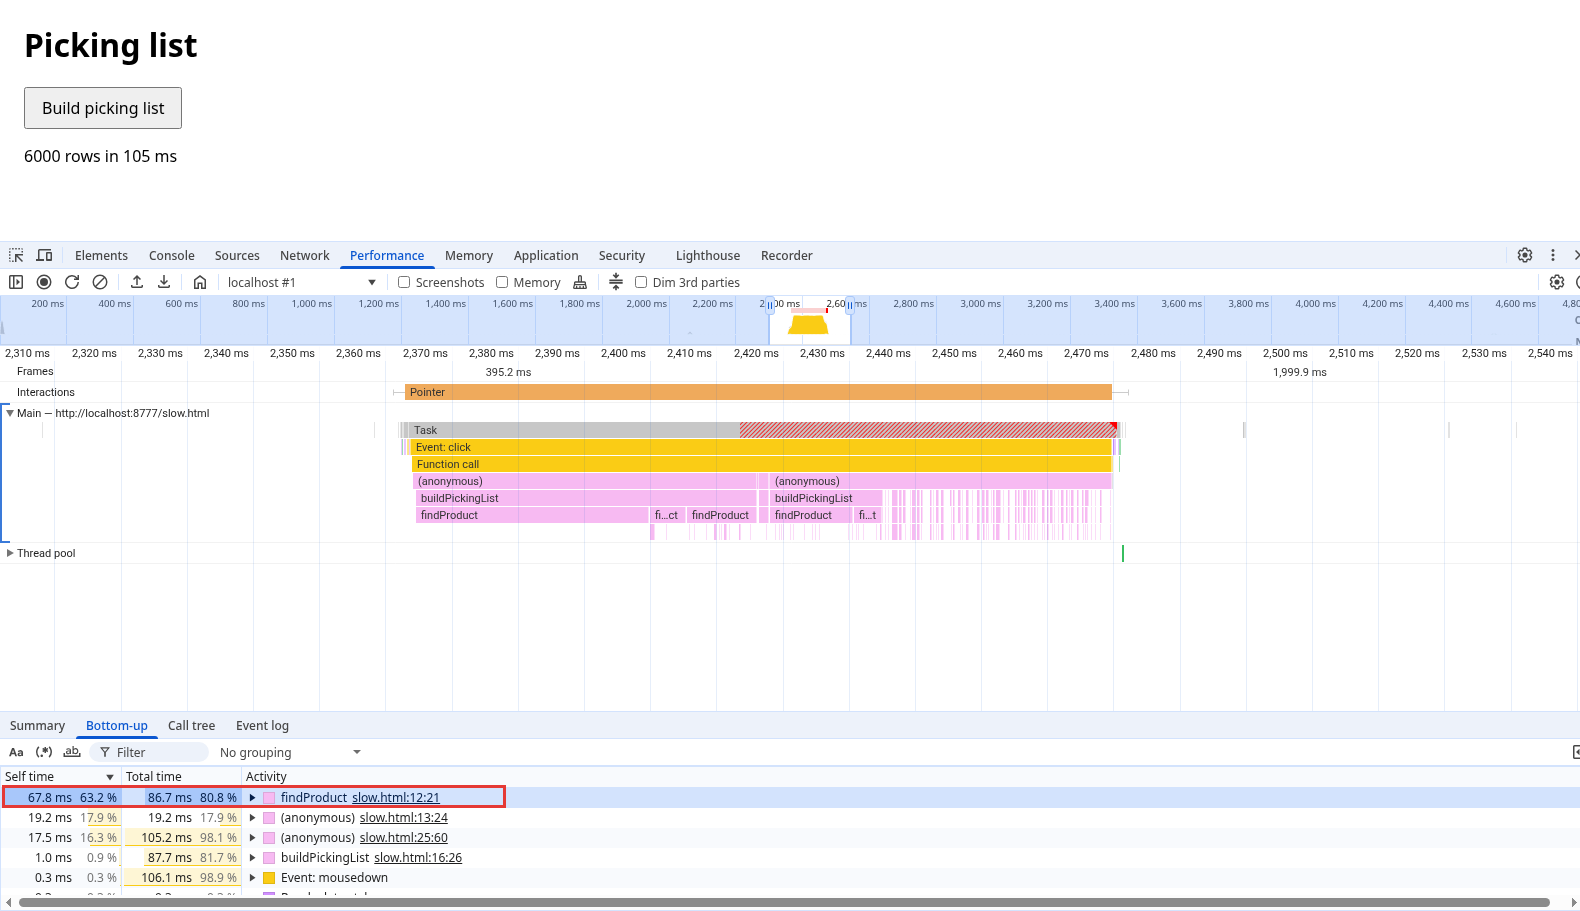
findProduct is at the top with 67.8 ms self time and 86.7 ms total. The (anonymous) row at slow.html:13 is the arrow function passed to find(), another 19.2 ms. Together that's almost all of the click. buildPickingList itself has only 1.0 ms of self time. It's slow because of what it calls, not because of its own code.
That's the difference between the two columns. Total time blames the function at the top of the chain. Self time shows where the work happens.
Why findProduct is slow
find() walks the products array from the start until it hits a match. It's called once per line, so 6,000 lines each scan up to 5,000 products. That's millions of comparisons to answer 6,000 lookups. Nothing is wrong with find(). Calling it inside a loop over a big list is the problem.
Fix it with a Map
Build a Map from SKU to product once, then look up by key. Only findProduct changes:
const products = Array.from({ length: 5000 }, (_, i) => ({ sku: "SKU-" + i, name: "Item " + i, shelf: "A" + (i % 40) }));
const lines = Array.from({ length: 6000 }, (_, i) => ({ orderId: 5000 + Math.floor(i / 3), sku: "SKU-" + ((i * 7919) % 5000), qty: 1 + (i % 4) }));

function buildPickingList(findProduct) {
  return lines.map(line => {
    const product = findProduct(line.sku);
    return { orderId: line.orderId, name: product.name, shelf: product.shelf, qty: line.qty };
  });
}

const slow = buildPickingList(sku => products.find(product => product.sku === sku));

const productsBySku = new Map(products.map(product => [product.sku, product]));
const fast = buildPickingList(sku => productsBySku.get(sku));

console.log(fast.length, fast[1]);
console.log("same result:", JSON.stringify(slow) === JSON.stringify(fast));
6000 { orderId: 5000, name: 'Item 2919', shelf: 'A39', qty: 2 }
same result: true
In the page, the change is two lines:
const productsBySku = new Map(products.map(product => [product.sku, product]));

function findProduct(sku) {
  return productsBySku.get(sku);
}
Always check the output is the same before you celebrate. A fast function that returns the wrong rows is not a fix.
Profile again and compare
Reload the page, record the same single click, and open Bottom-up again.
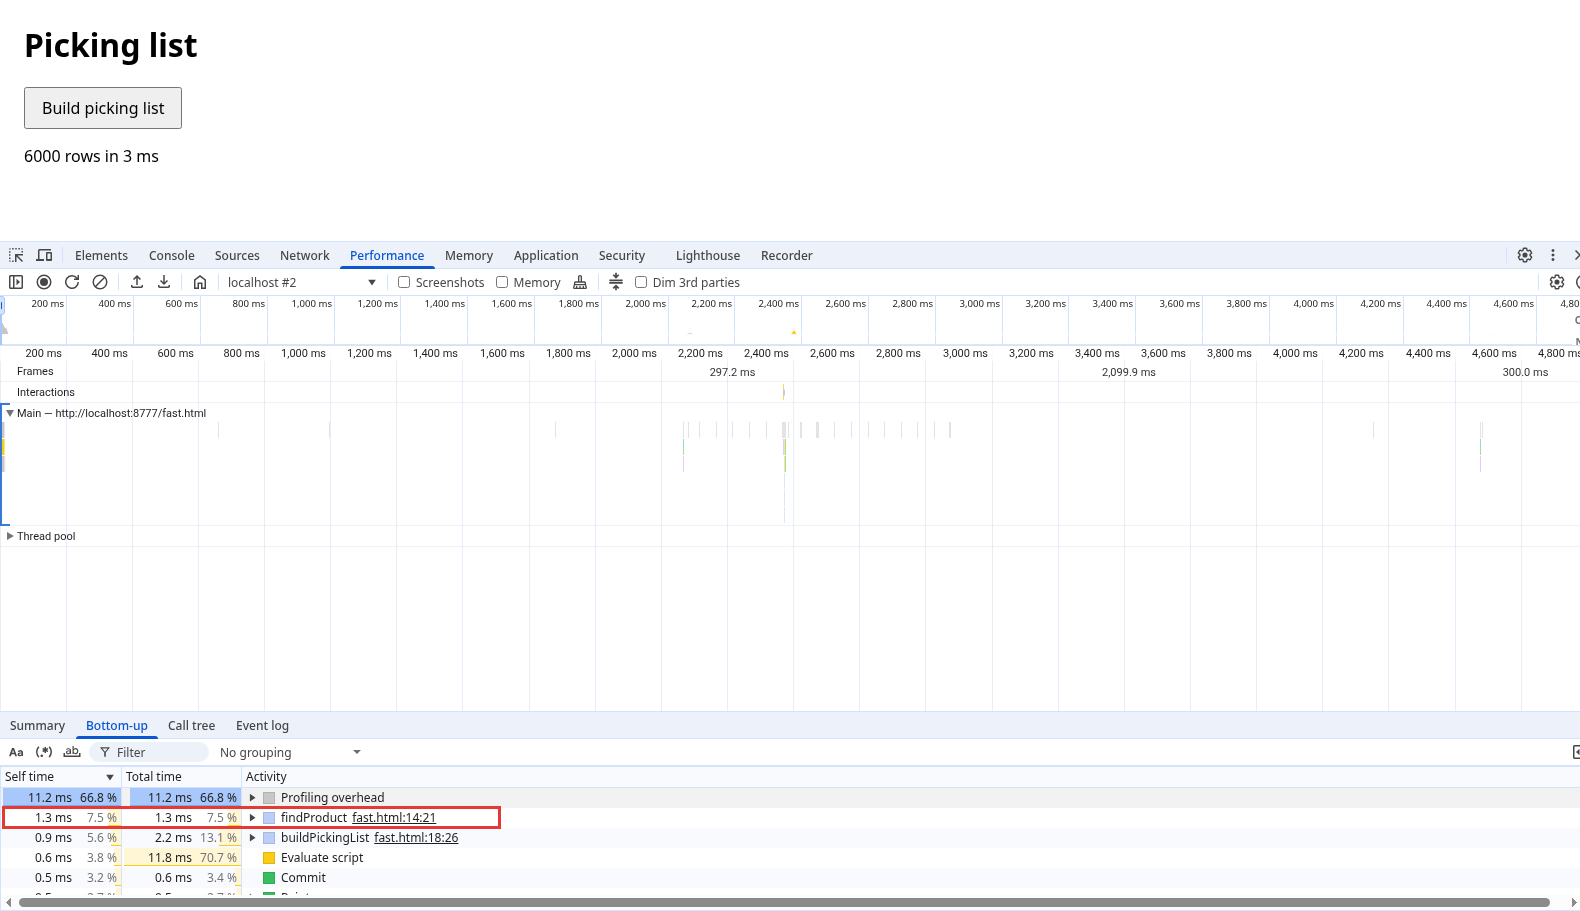
The page now says 6000 rows in 3 ms, down from 105 ms. findProduct dropped from 67.8 ms to 1.3 ms of self time, and the click is a thin line on the timeline. The top row is now Profiling overhead, the profiler measuring itself. When that's the biggest thing left, you're done with this click.
💡 Tip: Compare the same action, in the same tab, with the same data. Change one thing between recordings. If you change three things at once, you won't know which one helped.
⚠ Warning: Test with realistic data. With 50 products and 60 lines, the slow version also finishes in well under a millisecond, so the profile looks fine and the problem ships. This kind of slowness grows with the size of both lists.
Common mistakes
- Sorting by Total time and blaming the click handler, because everything runs inside it.
- Fixing the loop syntax (
forinstead offorEach) instead of the repeated search inside it. - Building the
MapinsidefindProduct, so it's rebuilt on every call and the page gets slower. - Skipping the second recording, so you don't actually know the fix worked.
Where in your code do you look something up by id inside a loop? Profile that click first.
About
Profile a picking list that takes 105 ms per click, find the lookup that does the damage, replace a repeated find() with a Map, and confirm it drops to 3 ms. After this, "the page feels slow" has a function name.
Reviews
Sign in to write a reviewComments (0)
Sign in to commentNo comments yet.