
Indexes and EXPLAIN: Why That Query Is Slow
Read a simple plan, see a sequential scan turn into an index scan and learn when an index is not used. After this, you can check a slow query with EXPLAIN before you add anything.
Skip ahead: If you already read EXPLAIN output and only want the cases where an index is ignored, skip to "When the index is not used", then continue.
"The query is slow" is not a diagnosis. It is a symptom, and the first question is what the database is doing. EXPLAIN shows the plan, which is the list of steps PostgreSQL chose. An index is the most common fix, and also the most common thing people add without checking whether it helps. This lesson reads a plan before it adds anything.
The shop is too small to feel slowness, so this lesson makes a bigger table. The numbers are invented and generated with generate_series, so every run gives the same data.
A table big enough to matter
CREATE TABLE big_orders AS
SELECT g                                  AS order_id,
       (g % 1000) + 1                     AS customer_id,
       DATE '2026-01-01' + (g % 365)      AS order_date,
       ((g % 97) + 0.5)::numeric(8,2)     AS total
FROM generate_series(1, 100000) AS g;
ALTER TABLE big_orders ADD PRIMARY KEY (order_id);
ANALYZE big_orders;
SET max_parallel_workers_per_gather = 0;
SELECT 100000
ALTER TABLE
ANALYZE
SET
That is 100,000 orders spread over 1,000 customers, so each customer has 100 orders. ANALYZE gathers the statistics the planner uses to choose a plan. The SET turns off parallel workers for this session, so the plan is the same on every machine.
Read a plan
Ask for the plan of a simple lookup, and run it, with the options that keep the output repeatable. PostgreSQL 18 prints buffer counts by default, and those depend on what happens to be in the cache, so BUFFERS OFF removes them.
EXPLAIN (ANALYZE, BUFFERS OFF, COSTS OFF, TIMING OFF, SUMMARY OFF)
SELECT * FROM big_orders WHERE customer_id = 42;
                     QUERY PLAN
-----------------------------------------------------
 Seq Scan on big_orders (actual rows=100.00 loops=1)
   Filter: (customer_id = 42)
   Rows Removed by Filter: 99900
(3 rows)
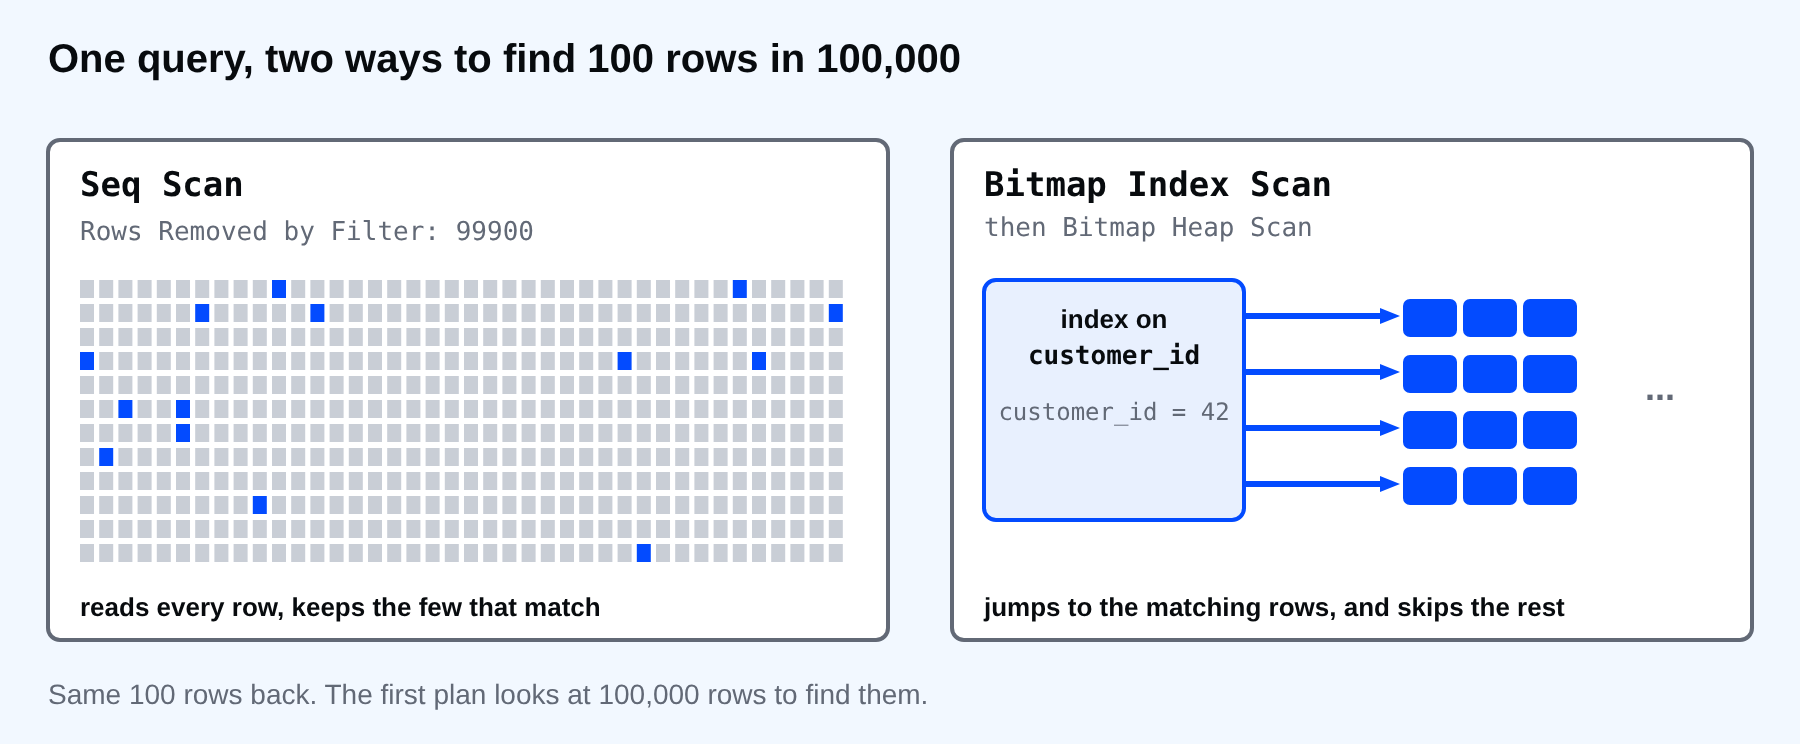
Read the plan from the innermost line. Seq Scan means PostgreSQL read every row of the table and kept those that match the filter. Rows Removed by Filter is the number it read and threw away. To return 100 rows it looked at 100,000. On a bigger table, or one asked many times a second, that is the slow query.
A normal EXPLAIN ANALYZE also prints cost estimates and timings. Those numbers change from run to run and from machine to machine, so this lesson hides them and quotes only the lines that are stable. When you compare two plans in real work, compare the plan shape and the rows first, and the times second.
⚠ Warning: EXPLAIN ANALYZE actually runs the statement. For a SELECT that is fine. For an INSERT, UPDATE or DELETE it changes the data. Wrap those in BEGIN and ROLLBACK.
Add the index and read the plan again
CREATE INDEX big_orders_customer_id_idx ON big_orders (customer_id);
ANALYZE big_orders;
EXPLAIN (ANALYZE, BUFFERS OFF, COSTS OFF, TIMING OFF, SUMMARY OFF)
SELECT * FROM big_orders WHERE customer_id = 42;
CREATE INDEX
ANALYZE
                                     QUERY PLAN
------------------------------------------------------------------------------------
 Bitmap Heap Scan on big_orders (actual rows=100.00 loops=1)
   Recheck Cond: (customer_id = 42)
   Heap Blocks: exact=100
   ->  Bitmap Index Scan on big_orders_customer_id_idx (actual rows=100.00 loops=1)
         Index Cond: (customer_id = 42)
         Index Searches: 1
(6 rows)
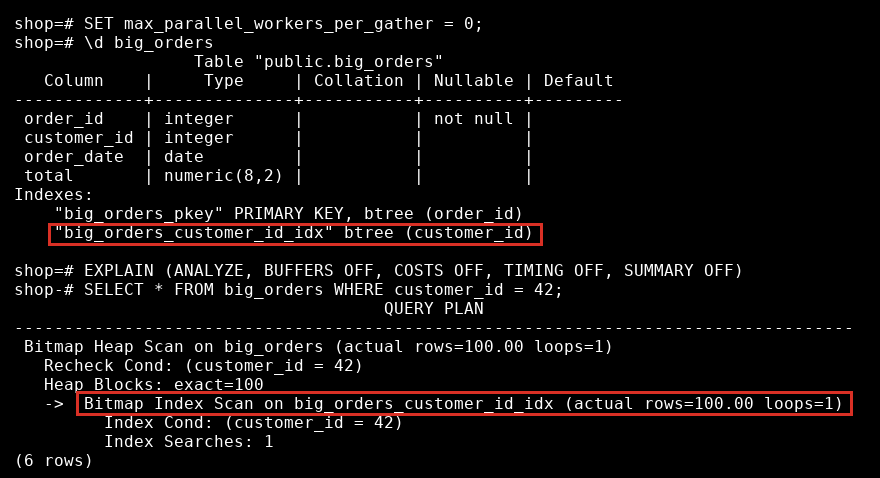
The plan changed shape. PostgreSQL first scanned the index to find where the matching rows are (Bitmap Index Scan), then visited just those table pages (Bitmap Heap Scan). The condition is now an Index Cond, not a filter, and no rows were thrown away. A bitmap scan is what PostgreSQL uses when many matches are spread over many pages. For a lookup of one row you will see Index Scan instead.
An index costs something. It takes disk space, and every INSERT and UPDATE has to keep it up to date.
SELECT pg_size_pretty(pg_relation_size('big_orders'))                 AS table_size,
       pg_size_pretty(pg_relation_size('big_orders_customer_id_idx')) AS index_size;
 table_size | index_size
------------+------------
 5120 kB    | 688 kB
(1 row)
When the index is not used
You added an index and the query is still slow. These are the usual reasons.
You wrapped the column in a function or a calculation. The index is on customer_id, not on customer_id + 1.
EXPLAIN (ANALYZE, BUFFERS OFF, COSTS OFF, TIMING OFF, SUMMARY OFF)
SELECT * FROM big_orders WHERE customer_id + 1 = 43;
                     QUERY PLAN
-----------------------------------------------------
 Seq Scan on big_orders (actual rows=100.00 loops=1)
   Filter: ((customer_id + 1) = 43)
   Rows Removed by Filter: 99900
(3 rows)
It is a sequential scan again. Rewrite the condition so the column stands alone, customer_id = 42, and the index can be used.
The query wants most of the table. An index is worth it when it lets the database skip most rows. If you ask for nearly everything, reading the table in order is cheaper.
CREATE INDEX big_orders_order_date_idx ON big_orders (order_date);
ANALYZE big_orders;
EXPLAIN (ANALYZE, BUFFERS OFF, COSTS OFF, TIMING OFF, SUMMARY OFF)
SELECT * FROM big_orders WHERE order_date >= DATE '2026-01-02';
CREATE INDEX
ANALYZE
                      QUERY PLAN
-------------------------------------------------------
 Seq Scan on big_orders (actual rows=99727.00 loops=1)
   Filter: (order_date >= '2026-01-02'::date)
   Rows Removed by Filter: 273
(3 rows)
The date index exists, and the planner ignored it because the condition matches almost every row. That is correct, not a bug. Do not force the plan. Check that your assumption about the data is right instead.
The statistics are old. If a table changed a lot since the last ANALYZE, the planner is working from the wrong numbers. Autovacuum normally keeps this up to date. Reading the planner's row estimates is a topic of its own.
Common mistakes
- Adding an index without looking at the plan first.
- Indexing a column and then filtering on a function of it.
- Expecting an index to help a query that returns most of the table.
- Adding indexes for every column "just in case". Each one slows writes.
- Running
EXPLAIN ANALYZEon an UPDATE or DELETE outside a transaction.
💡 Tip: Look at Rows Removed by Filter. A big number next to a small result is the sign of a scan that wants an index.
If you skip this, you will add an index because a blog said so, and the query will stay slow for a reason you never looked at. When did you last read the plan of the query you call slowest?
About
Read a simple plan, see a sequential scan turn into an index scan and learn when an index is not used. After this, you can check a slow query with EXPLAIN before you add anything.
Comments (0)
Sign in to commentNo comments yet.