

Finding Slow Code With the Performance Profiler
Measure first, record a profile in Chrome DevTools or Node, read the flame chart and fix the function that actually costs time. After this, you stop optimizing code that was never slow.
Skip ahead: If you've recorded a performance profile before, skip to "Read the Bottom-up tab".
When code is slow, most people guess which part is slow, and most guesses are wrong. A profiler records where the time actually went, function by function. Measure first, change one thing, measure again. That's the whole method. The rest is knowing which buttons to press.
The example
A report page. For each order, it shows the total spent by that order's customer. With 8,000 orders, clicking "Build report" took about 300 ms in Chrome, and the page froze for that long.
const orders = Array.from({ length: 8000 }, (_, i) => ({ id: 1000 + i, customer: "C" + (i % 400), total: (i * 37) % 5000 }));

function findCustomerOrders(customer) {
  return orders.filter(order => order.customer === customer);
}

function buildReport() {
  const rows = [];
  for (const order of orders) {
    const sameCustomer = findCustomerOrders(order.customer);
    const customerTotal = sameCustomer.reduce((sum, o) => sum + o.total, 0);
    rows.push({ id: order.id, customerTotal });
  }
  return rows;
}
Measure first
Before opening any tool, put a number on it. performance.now() works in the browser and in Node:
const start = performance.now();
buildReport();
console.log(`${Math.round(performance.now() - start)} ms`);
Write the number down. Without it, you can't tell if your fix helped.
Record a profile in Chrome
- Open DevTools (F12) and go to the Performance tab.
- Click the record button (the circle), do the slow thing (click "Build report"), then click Stop.
- In the timeline at the top, drag over the yellow block to zoom into it. Yellow is JavaScript.
The flame chart under Main shows what was running over time. Each bar is a function. The bars below it are the functions it called. A wide bar took a long time. Look for wide bars low in the stack. That's where the time was actually spent.
Read the Bottom-up tab
The flame chart is good for seeing the shape. The Bottom-up tab is better for finding the culprit. It lists functions by Self time, the time spent in that function itself, not in functions it called.
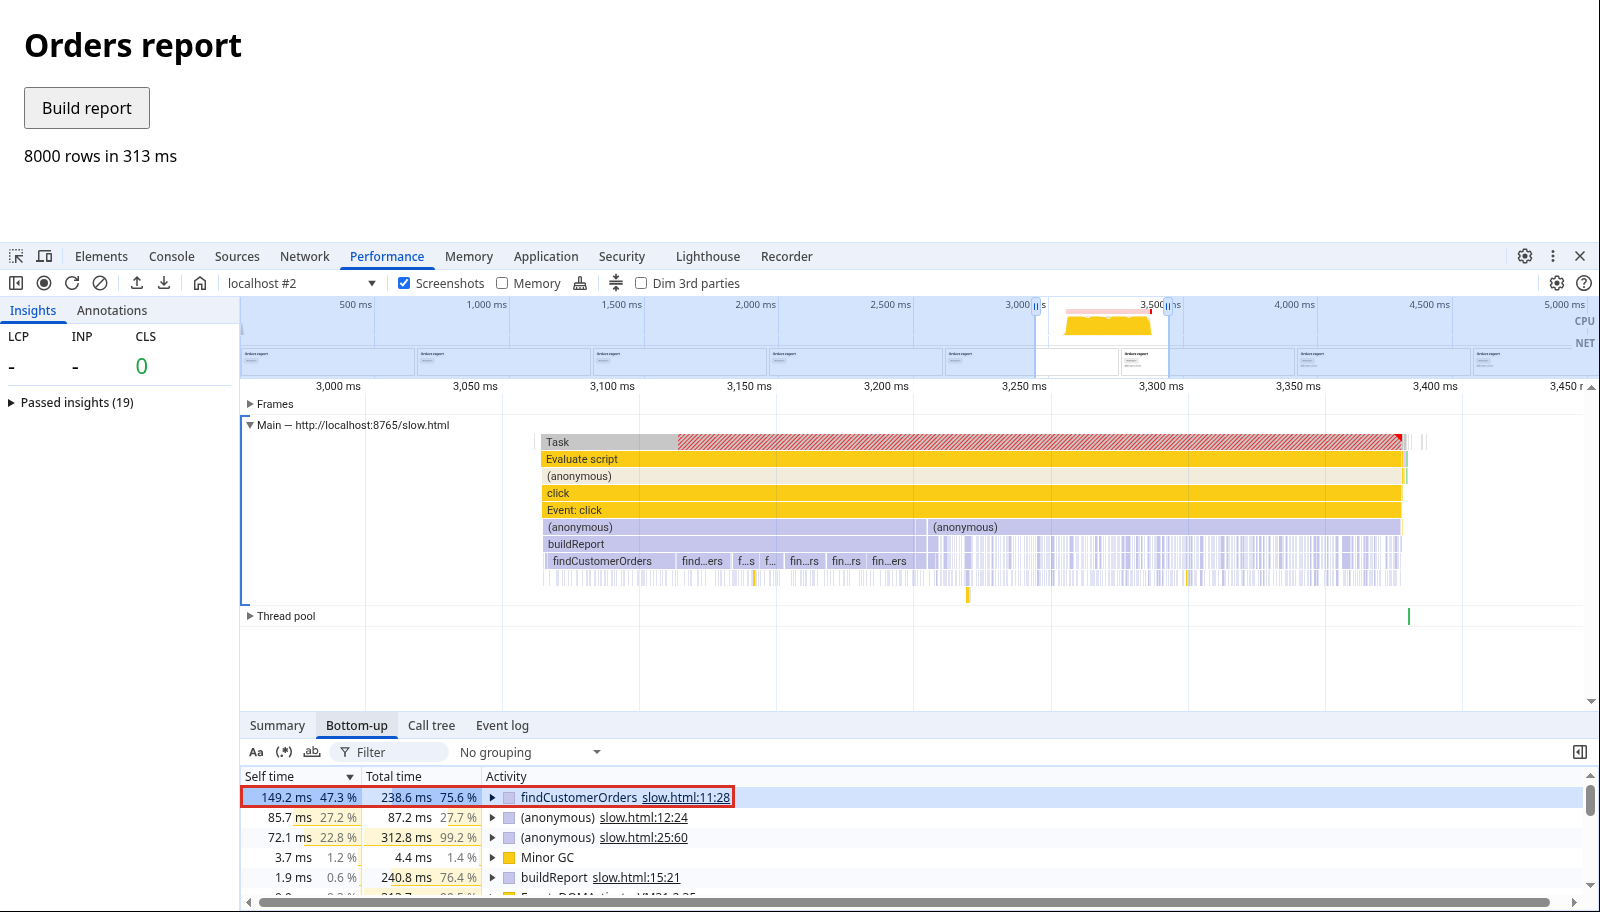
findCustomerOrders is at the top: 149 ms self time, and 239 ms total, which is about three quarters of the whole click. The (anonymous) rows under it are mostly the little arrow functions passed to filter and reduce, called millions of times.
Now the cause is obvious: for every one of the 8,000 orders, findCustomerOrders loops through all 8,000 orders again. That's 64 million comparisons to answer a question that needs 8,000.
Fix the right thing
Group once, then look up:
function buildReport() {
  const totals = new Map();
  for (const order of orders) {
    totals.set(order.customer, (totals.get(order.customer) ?? 0) + order.total);
  }
  return orders.map(order => ({ id: order.id, customerTotal: totals.get(order.customer) }));
}
Measured the same way in the same Chrome tab: the old version took 295 ms, the new one under 3 ms. Same result, 8,000 rows. Nobody tuned a loop or rewrote anything in a "faster" syntax. The fix was not doing the same work 8,000 times.
💡 Tip: Most real slowness is this kind of thing: a loop inside a loop, the same API call in every row, a DOM read inside a loop that forces layout each time. Micro-optimizations (for instead of forEach) almost never show up in a profile.
Profiling Node
For a Node script or server:
node --cpu-prof report.js
That writes a .cpuprofile file in the current folder. Open DevTools, go to the Performance tab and load it (the upload arrow), and you get the same flame chart and Bottom-up view. For a running server, start it with node --inspect server.js, open chrome://inspect in Chrome, and record while you send it requests.
⚠ Warning: Profile with realistic data. The report above takes a few milliseconds with 200 test orders, because the problem grows with the square of the data. Profiling with tiny test data tells you everything is fast.
Common mistakes
- Optimizing before measuring.
- Looking at Total time instead of Self time, and blaming
main()because everything is inside it. - Profiling with 20 rows of sample data.
- Fixing three things at once and not knowing which one helped.
- Recording for a minute when the slow part takes one second. Short recordings are easier to read.
What happens if you skip this
You'll spend a day rewriting code that was never the problem, the page stays slow, and the next person concludes JavaScript is just slow.
In buildReport, how many times would filter run with 80,000 orders instead of 8,000, and how much longer would you expect the click to take?
About
Measure first, record a profile in Chrome DevTools or Node, read the flame chart and fix the function that actually costs time. After this, you stop optimizing code that was never slow.
Comments (0)
Sign in to commentNo comments yet.