

Memory Leaks: Event Listeners and Closures That Never Let Go
What a leak looks like in JavaScript, the usual causes, and how to prove one with heap snapshots. After this, a page that gets slower every hour has a cause you can find.
Skip ahead: If you know what a leak is and want the heap snapshot steps, skip to "Prove it with heap snapshots".
JavaScript frees memory for you, but only memory nothing points to anymore. A leak in JavaScript isn't memory the engine forgot. It's memory your code still holds on to, usually by accident. The page doesn't crash. It just gets slower every hour, until someone refreshes it and the problem "goes away". On a Node server, it grows until the process is killed and restarted.
How the garbage collector decides
Starting from the roots (the global object, the current call stack, active timers and listeners), the engine follows every reference. Anything it can reach is kept. Anything it can't reach is freed. So the question for any leak is: what can still reach this object?
The usual causes
- Event listeners that are never removed.
window.addEventListener("resize", handler)keepshandleralive as long as the window exists. Ifhandleris a closure, everything it refers to stays too. - Timers that are never cleared. A
setIntervalkeeps its callback, and the callback's closure, alive forever. - Caches and maps that only grow. A
Mapused as a cache with no limit holds every key it ever saw. - Detached DOM elements. An element removed from the page but still referenced from a variable or array can't be freed, along with everything under it.
- Closures holding more than they need. A small callback that refers to a large object keeps the whole object.
A real leak
A dialog class. Every time the user opens and closes it, a new instance is created. Each one holds some data and listens for window resizes:
class OrderDialog {
  constructor() {
    this.history = new Array(100000).fill("order line");
    this.onResize = () => this.layout();
    window.addEventListener("resize", this.onResize);
  }
  layout() {
    return this.history.length;
  }
  close() {
    // Bug: the resize listener is never removed, so every dialog stays in memory.
  }
}
After close(), your code has no variable pointing at the dialog. It should be freed. But window holds the listener, the listener is an arrow function, the arrow function's closure holds this, and this is the dialog with its 100,000-item array. Ten opens, ten dialogs that never go away.
Prove it with heap snapshots
Don't guess. Measure it, the same way as with slow code:
- Open DevTools, go to the Memory tab, choose Heap snapshot, and click Take snapshot. This is the baseline.
- Do the action you suspect several times. Here: open and close the dialog 10 times.
- Take a second snapshot.
- Select the second snapshot, switch the view from Summary to Comparison, and compare it with Snapshot 1.
- Sort by # Delta, or type a class name in Filter by class. Look for objects that went up by roughly the number of times you repeated the action.
- Click one of those objects. The Retainers panel at the bottom shows what is holding on to it.
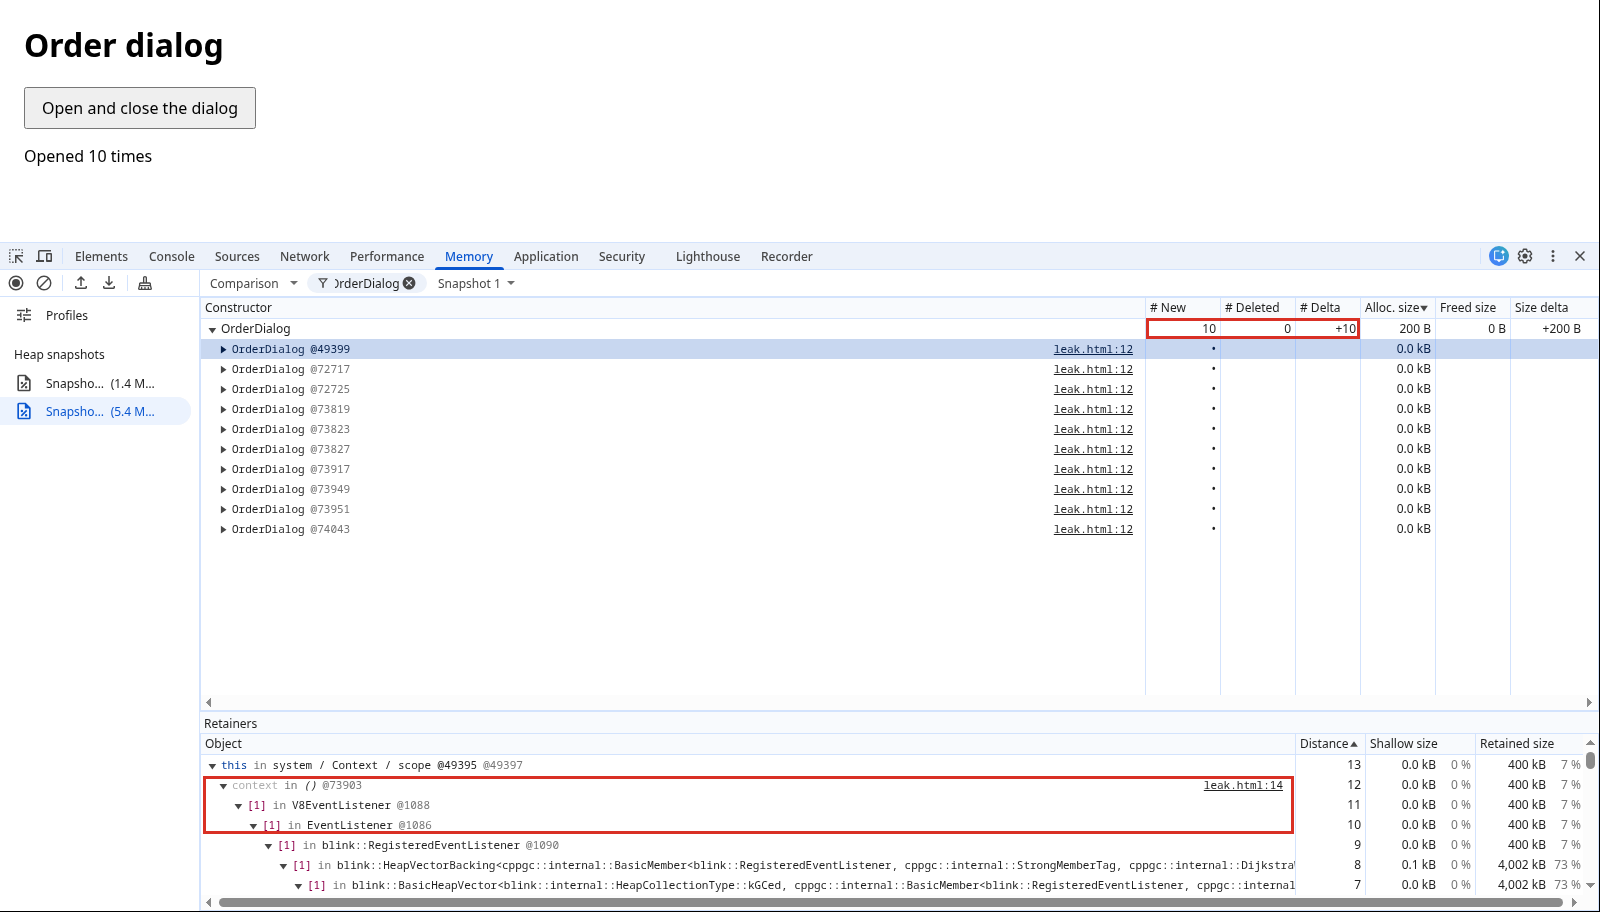
Read it bottom-up like a chain: OrderDialog is held by a closure context created on line 14 (the this.onResize = () => ... line), which is held by a V8EventListener, which is an EventListener registered on the window. 10 new, 0 deleted. That's the leak, with the line number.
💡 Tip: Chrome runs garbage collection before taking a heap snapshot, so anything still in the snapshot really is reachable. If an object shows up in the comparison, something is holding it.
The fix
Remove what you added, with the exact same function:
close() {
  window.removeEventListener("resize", this.onResize);
}
Take the two snapshots again. The OrderDialog delta should drop to 0. If it doesn't, the Retainers panel shows the next thing holding it.
An AbortController makes cleanup easier when there are many listeners. Pass one signal to all of them, and one abort() removes them all:
class OrderDialog {
  #cleanup = new AbortController();
  constructor() {
    const { signal } = this.#cleanup;
    window.addEventListener("resize", () => this.layout(), { signal });
    document.addEventListener("keydown", event => this.onKey(event), { signal });
  }
  close() {
    this.#cleanup.abort();
  }
}
Other fixes for the other causes
- Clear timers: keep the id from
setIntervaland callclearIntervalin your cleanup. - Give caches a limit, or evict old entries. If the key is an object and you only need data while that object exists, use a
WeakMap. It doesn't keep its keys alive. - When you remove an element from the page, also drop your own references to it.
- In a closure, copy out the small value you need instead of referring to the large object.
⚠ Warning: Not every growth is a leak. Memory goes up and down as the page works, and the engine collects when it wants to. A leak is memory that keeps growing across repeated actions and never comes back down. That's why you compare snapshots after repeating the same action, instead of staring at one number.
Node servers
The same method works in Node. Start the server with node --inspect server.js, open chrome://inspect, and use the same Memory tab. Take a snapshot, send a few hundred requests, take another, compare. On servers, the usual suspects are module-level caches and listeners added per request to something long-lived, like a database client.
Common mistakes
- Calling
removeEventListenerwith a new arrow function or a newbind. It removes nothing. setIntervalin a component with no cleanup.- An unlimited
Mapcache keyed by request id or user id. - Reading one memory number once and calling it a leak, or not a leak.
What happens if you skip this
Your app passes every test, because tests run for seconds. In production it runs for days, and "restart it every night" becomes part of the deployment plan.
In the leaking dialog, would the leak still happen if onResize were a normal method passed as this.layout.bind(this)? What would the Retainers panel show instead?
About
What a leak looks like in JavaScript, the usual causes, and how to prove one with heap snapshots. After this, a page that gets slower every hour has a cause you can find.
Comments (0)
Sign in to commentNo comments yet.